Why Montenegro · Economy
A fast rebound is settling into steady growth
Montenegro came out of the pandemic faster than most of the region, with average real growth of 7.6% a year in 2021–2024. The rebound is over. What matters now is a slower but steadier economy, a tight coastal labour market and an external deficit financed largely by foreign capital.
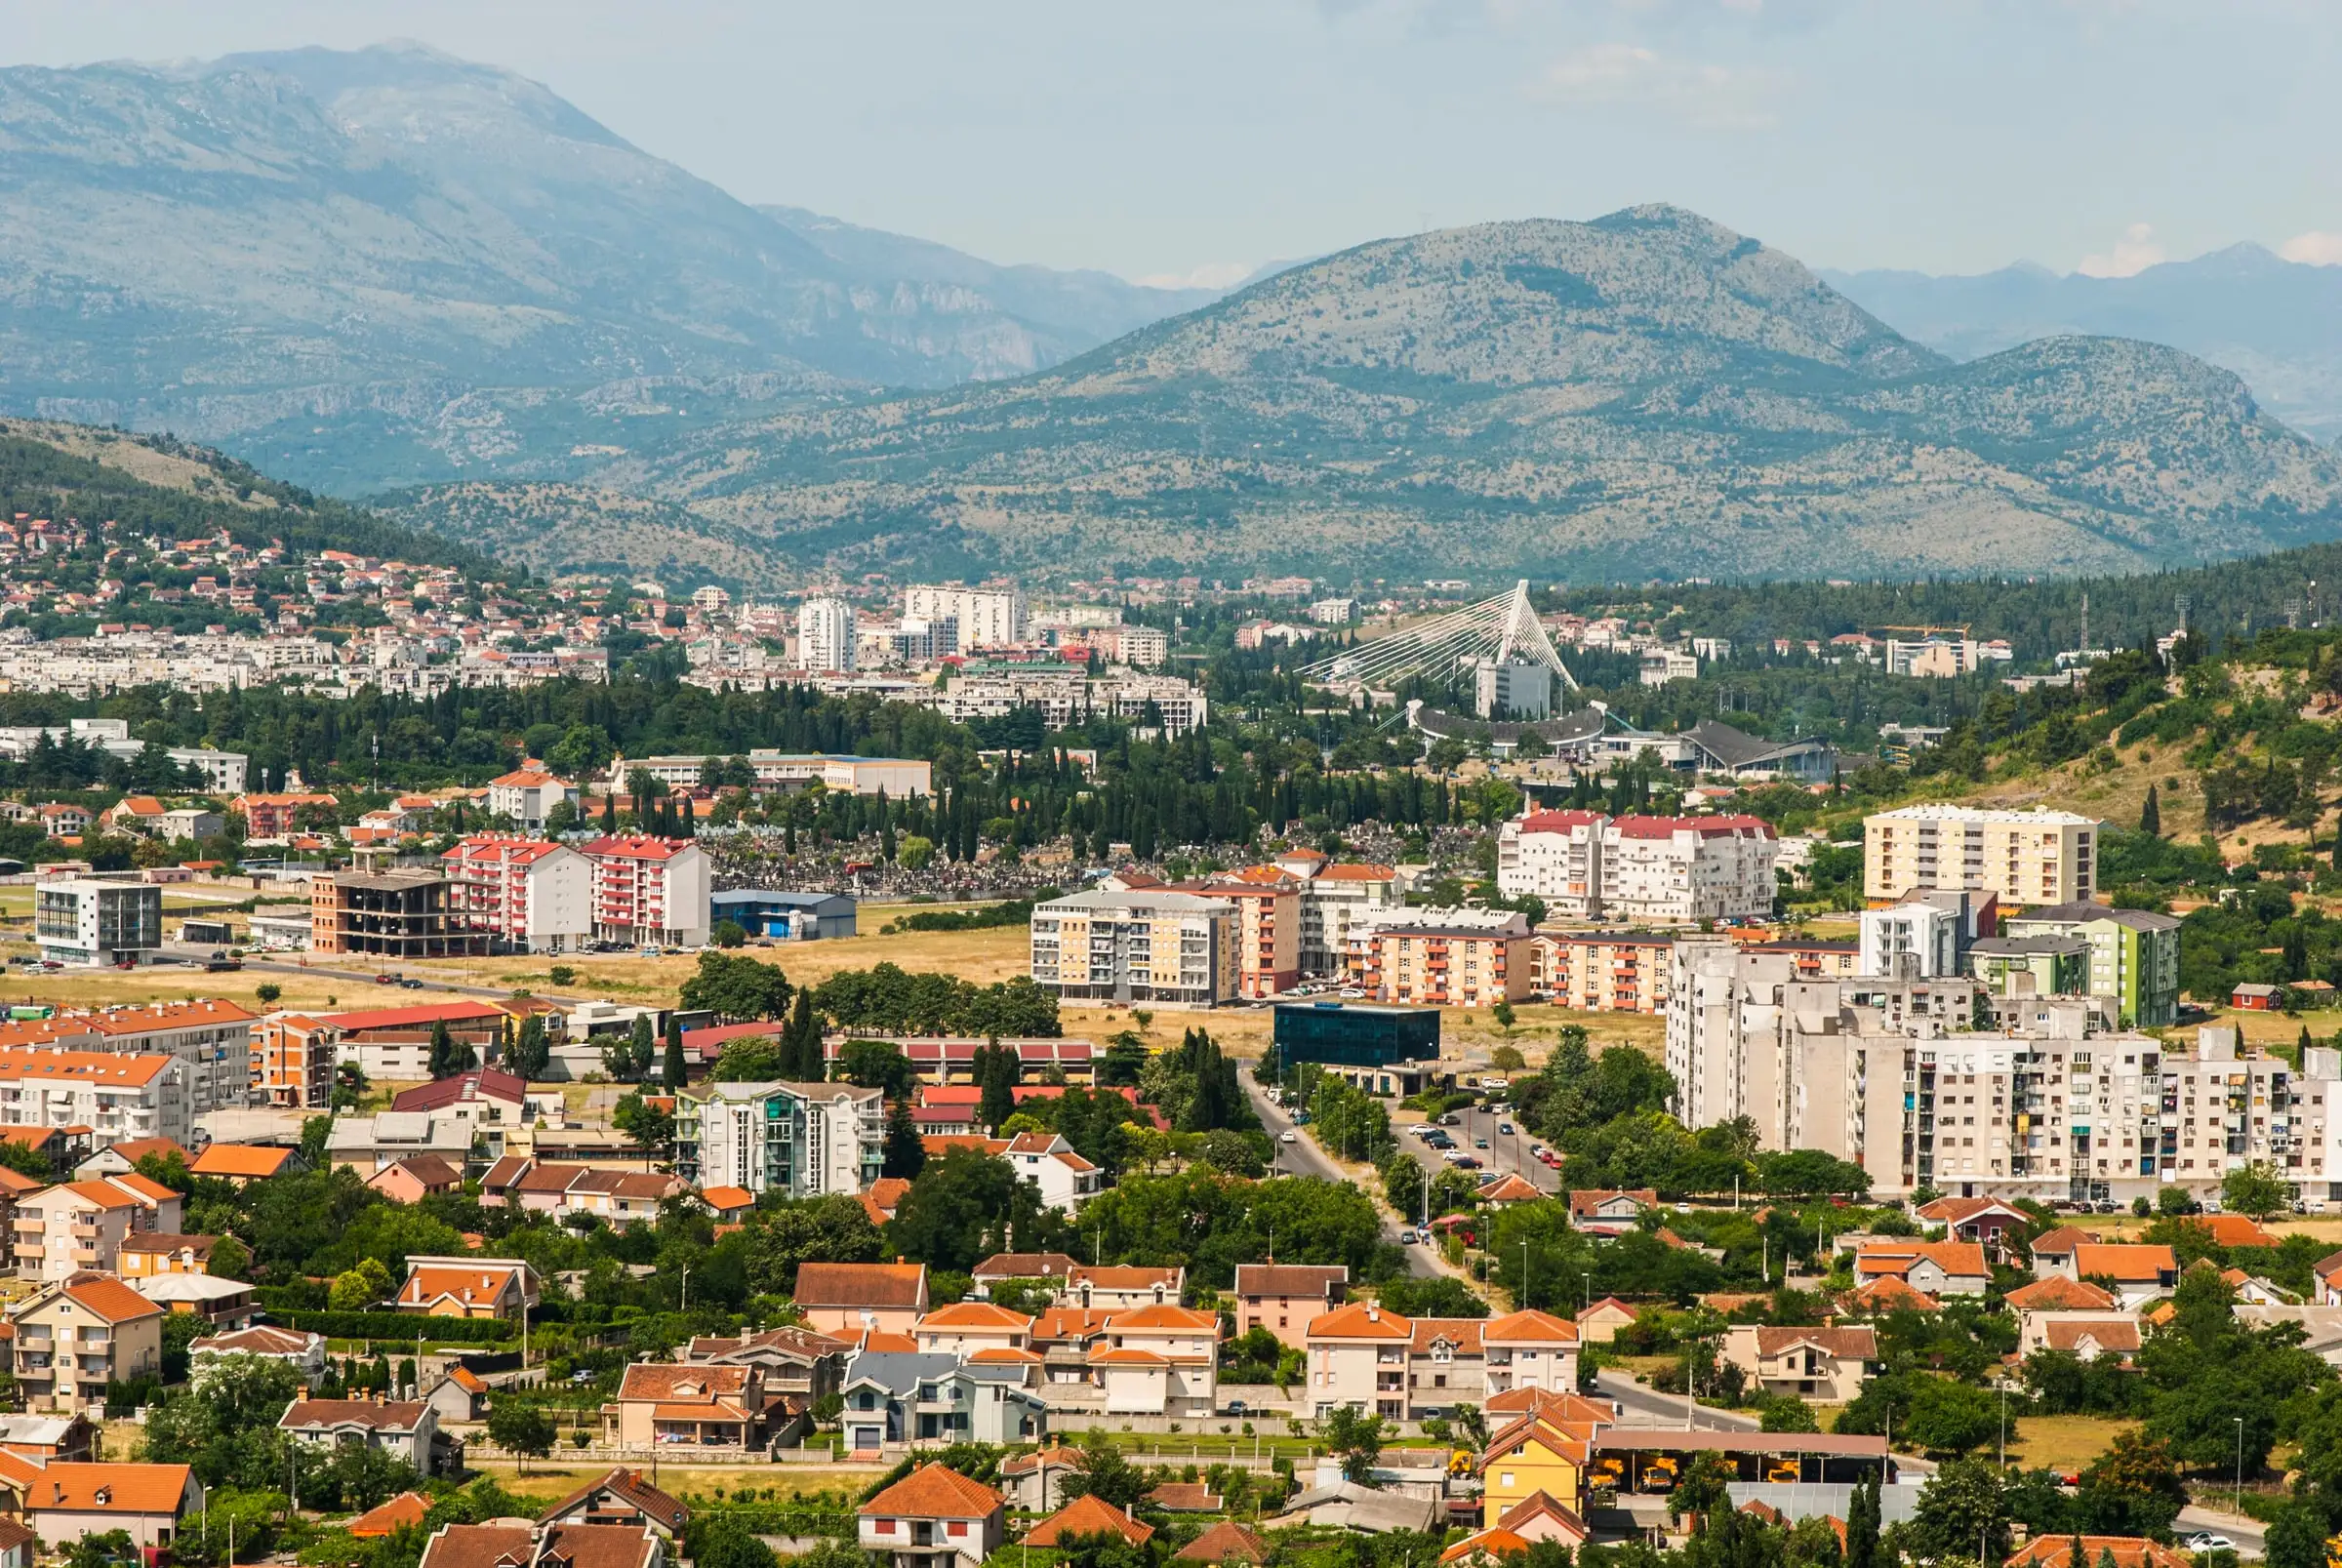
Podgorica
7.6%
Average real GDP growth
2.7%
Real GDP growth
3.9%
Consumer price inflation
10.7%
Unemployment rate
From deep recession to normal growth
The pandemic hit Montenegro hard. With tourism stopped, output fell by −15% in 2020. The recovery was just as sharp: real growth averaged about 9% a year from 2021 to 2023, carried by returning visitors and by a wave of high-income migrants who settled in the country. Nominal GDP reached €7.6bn in 2024, with €8.3bn projected for 2025. Income per head rose from $7,549 in 2020 to $13,259 in 2024.
Growth then cooled to 3.2% in 2024 and 2.7% in 2025. The IMF projects 2.8% for 2026 and just under 3% over the medium term, close to what the economy can sustain. That is in line with the Western Balkans as a whole, which grew around 3.5% in 2025, and with a world economy projected to grow 3.0% in 2026.
For underwriting, the lesson is to model demand on the normalised trend, not on the rebound years. The IMF has also warned that global financial conditions have tightened again, so treat the cost of debt as a variable to stress-test rather than a fixed input.
Montenegro: Selected Economic Indicators, 2020–2026
* Projection
Show the data
| Year | Nominal GDP (USD bn) | Real GDP growth (%) | GDP per capita (USD thousand) | CPI inflation, avg. (%) | Unemployment rate (%) | Average net wage (EUR/month) | General govt. debt (% GDP) | Current account (% GDP) | Net FDI (% GDP) |
|---|---|---|---|---|---|---|---|---|---|
| 2020 | 4.7 | -15 | 7.6 | 0.4 | 17.9 | — | 108.4 | -26.3 | 11.4 |
| 2021 | 5.8 | 13 | 9.4 | 2.4 | 16.6 | 524 | 84.5 | -9.2 | 11.2 |
| 2022 | 6.3 | 7.7 | 10 | 13 | 14.7 | 633 | 70.3 | -12.9 | 13.3 |
| 2023 | 7.7 | 6.5 | 12.3 | 8.6 | 13.1 | 793 | 59.6 | -11.2 | 6.1 |
| 2024 | 8.3 | 3.2 | 13.3 | 3.3 | 11.4 | 877 | 60.8 | -17.1 | 6.4 |
| 2025 | 9.2 | 2.7 | 14.8 | 3.9 | 10.7 | 1,012 | 67.1 | -20.5 | 6.9 |
| 2026 (projection) | 10.2 | 2.8 | 16.4 | 3.2 | — | — | 62.4 | -19.4 | 7.4 |
Figure 1.1, Montenegro: Selected Economic Indicators, 2020–2026 (UN Tourism, 2026, p. 23). Underlying source: International Monetary Fund, World Economic Outlook Database, August 2026 edition, https://www.imf.org/external/datamapper/datasets/WEO; MONSTAT, Labour Force Survey 2025 and Average Earnings release (January–March 2026).
Prices and the euro
Inflation peaked at 13% in 2022 and has since come down to 3.9% in 2025. It is projected to move toward 2% by 2027–2028, close to the euro area target. Montenegro uses the euro as its currency, so there is no exchange-rate risk for a euro-funded project: construction costs, loans, room rates and payroll are all in the same currency.
The flip side is that the country cannot devalue to restore competitiveness. Prices across the Western Balkans have risen faster than in the euro area in recent years, and that feeds through into building and operating costs. The IMF judges that the real exchange rate has appreciated only moderately compared with Western Balkan peers.
Public finances and the external balance
The budget moved from a surplus of 0.4% of GDP in 2023 to a deficit of 3.4% of GDP in 2024, partly because the Europe Now 2 reform cut social security contributions. Public debt has fallen a long way, from 108% of GDP in 2020 to 59.6% of GDP in 2023, but it ticked up to 60.8% of GDP in 2024. The IMF table shows 67.1% of GDP in 2025 and 62.4% of GDP projected for 2026.
Getting debt below 60% of GDP by 2028 would take further measures. Those discussed include holding down the public wage bill, saving airport concession revenue and trimming tax expenditures. Investors relying on a tax relief should note that last item: reliefs are what tax expenditures are, and they can be narrowed.
The current account deficit is large: 17.1% of GDP in 2024 and 20.5% of GDP in 2025, after tourism receipts levelled off, goods exports fell and household imports stayed strong. Net FDI covered part of the gap, at 6.4% of GDP in 2024 and 6.9% of GDP in 2025. In plain terms, the economy depends on a steady inflow of foreign capital, much of it into property and hotels. That is both a sign of investor appetite and a vulnerability if flows dry up.
Jobs, wages and hotel payrolls
Unemployment fell from 17.9% in 2020 to 11.4% in 2024 and 10.7% in 2025, one of the lowest readings in the Labour Force Survey series. The national figure hides a wide regional gap. In 2025 unemployment was 6.7% on the coast and 8.6% in the central region, but 19.6% in the north.
Pay has risen fast. The average net wage was €1,012 a month in 2025 (gross €1,206 a month), up from €524 a month in 2021. With prices up 3.9%, real net earnings grew 11.2% in a single year.
For a hotel, this has two effects. Higher wages lift domestic spending on travel, dining and leisure. They also raise payroll, often the largest single operating cost, and the pressure is greatest on the coast, where the labour pool is thinnest and the season is short. Budget for staff housing, seasonal recruitment from abroad and continued wage growth. In the north the position is reversed: more people looking for work, which is one reason the Government is steering new tourism projects there. See the northern region and the tourism strategy.
How it compares with its neighbours
Against four regional peers, Montenegro has the second-highest income per head after Serbia, but it grew more slowly in 2025 than Albania or North Macedonia. What sets it apart is the weight of tourism: the sector accounts for a larger share of the economy than in any other Western Balkan country, and about 45% of all exports in 2024. That makes Montenegro more exposed to swings in international travel than its neighbours. It also means that a new airport route, road or resort tends to ripple through the rest of the economy.
Comparative Indicators: Montenegro and Selected Peers, 2025
Show the data
| Country | GDP per capita (USD thousands) | Real GDP growth (%) |
|---|---|---|
| Montenegro | 14.78 | 2.7 |
| Albania | 11.23 | 3.7 |
| North Macedonia | 10.6 | 3.5 |
| Bosnia and Herzegovina | 9.6 | 2 |
| Serbia | 15.3 | 2 |
Figure 1.2, Comparative Indicators: Montenegro and Selected Peers, 2025 (UN Tourism, 2026, p. 26). Underlying source: IMF WEO (April 2026); World Bank; national statistical offices.
The two charts on this page come from different IMF releases, so Montenegro's 2025 income per head differs slightly between them. Figures from 2026 onward are projections.